Overview
Contents
# Install the necessary dependencies

import os
import sys
!{sys.executable} -m pip install --quiet seaborn pandas scikit-learn numpy matplotlib jupyterlab_myst ipython
34. Overview#
Moving Machine Learning models into production is as important as building them, sometimes even harder. Maintaining data quality and model accuracy over time are just a few of the challenges. To achieve end-to-end system productionization as a whole, the various components and designs need to be identified, from defining a problem to serving the model as a service.
According to the Algorithmia statistics, 55% of businesses working on ML models have yet to get them into production.
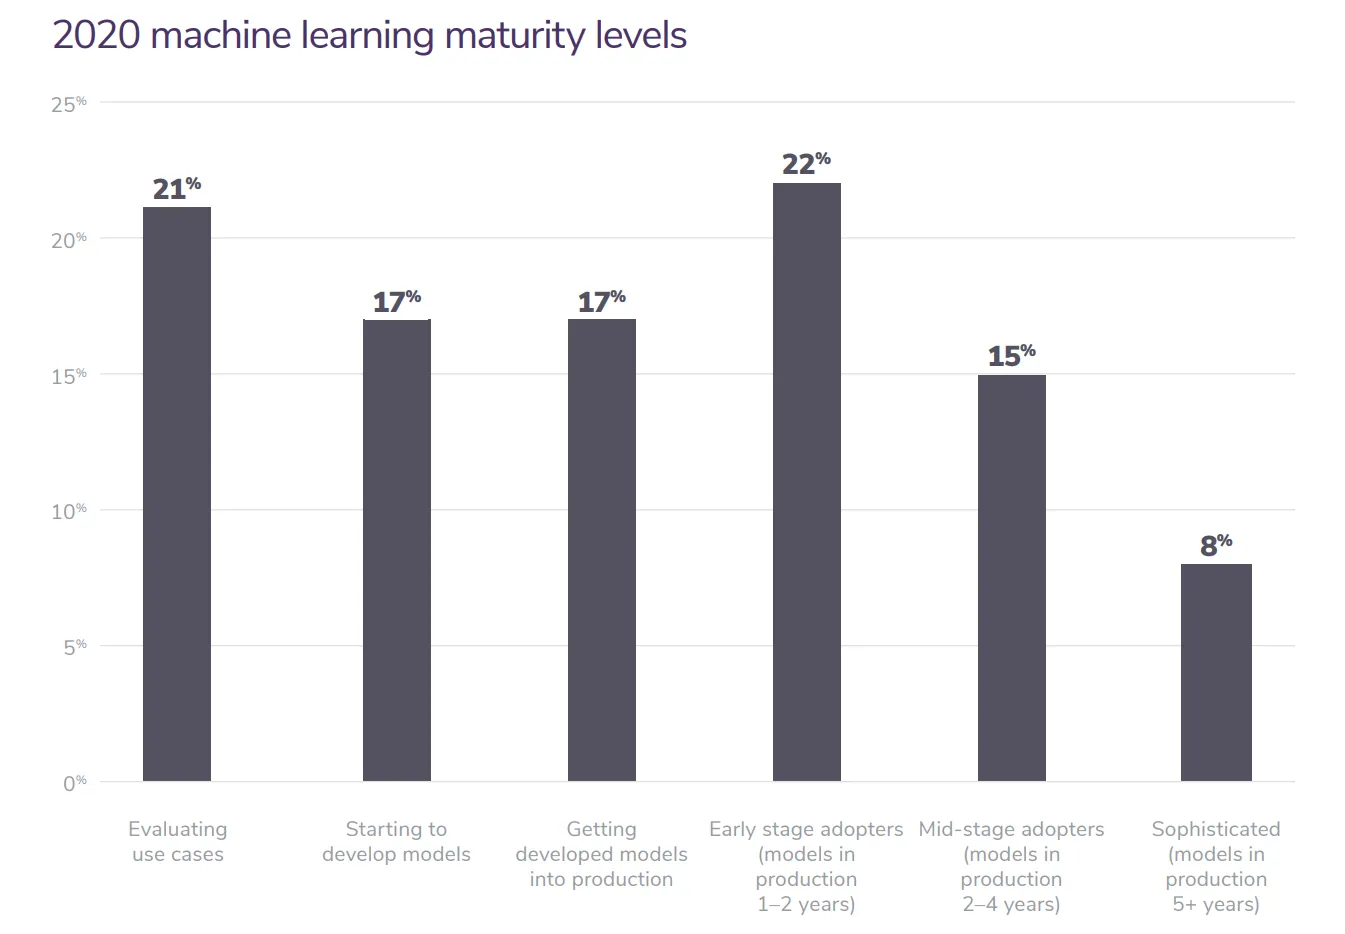
Fig. 34.1 the 2020 State of Enterprise ML by Algorithmia based on 750 businesses#
This is because there are many problems and challenges between the theoretical study of the model and the actual production deployment:
(1)POC to production gap:
There is a huge gap from Proof of Concept (POC) to actual final product or service deployment in production, with only a tiny fraction of the complete machine learning service model actually invested consisting of ML code, and the surrounding infrastructure required for this is large and complex. At the same time, this gap may also involve challenges in technology, resources, security, stability and other aspects.
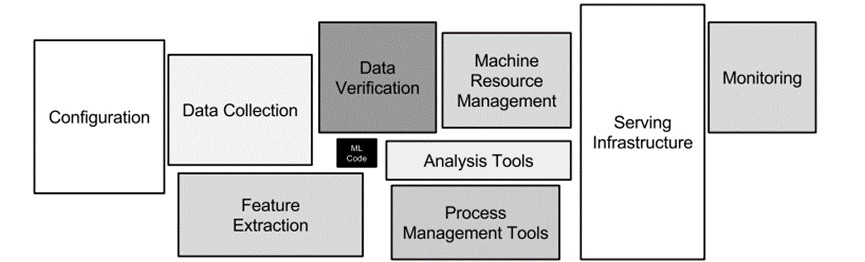
Fig. 34.2 the portion of ML code that is part of a complete ML system#
(2) data drift and concept drift:
Models do not last forever and sometimes degrade over time, even if the data itself is of good quality. Sometimes, model performance degrades due to data quality degradation:
Data drift usually means that the variable distribution of the input data (x) changes, and the trained model is not related to this new data, so the performance will decline. For example, an e-commerce platform sets up a predictive model to predict the purchase possibility of users to push personalized offers, but at the beginning, the training and application of the model are based on the user data of spontaneous paid search. When the e-commerce platform launches a new advertising campaign, the users attracted by the new influx of advertisements do not adapt to the model previously analyzed.
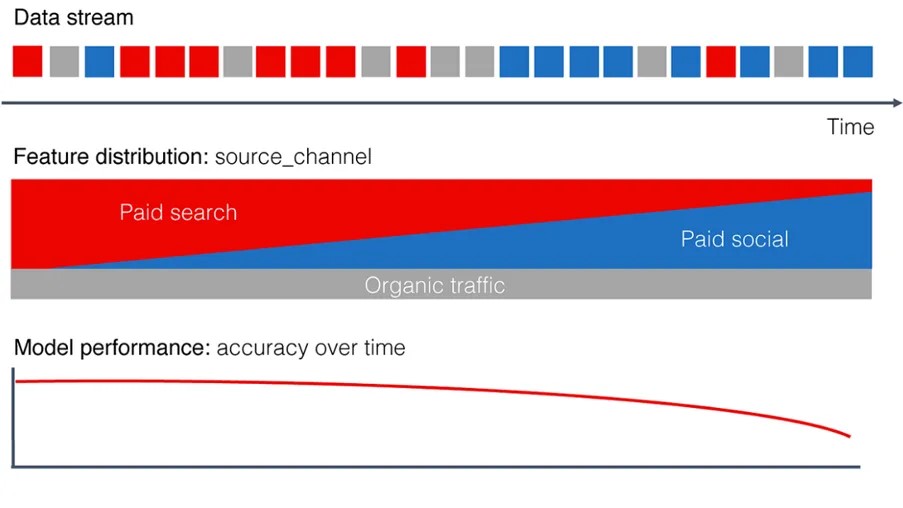
Fig. 34.3 Continuous blue squares in the Data stream indicate the start of a Data Drift#
Concept drift usually means that the mapping between input and output changes (x->y), the pattern learned by the model is no longer valid, and what changes is not the data itself, but the statistical properties of the target domain have changed over time, that is, the so-called “world has changed”. Sometimes these changes happen very quickly or even unexpectedly, as in the case of the COVID-19 outbreak, the Black Swan event, which dramatically increases the demand for gowns and masks in response to changes in government policies; Sometimes it is a slow change, for example, customers’ online shopping preferences change with changes in personal interests, merchants’ reputation, and service types.
These data changes will affect the performance of the model and cause serious problems in the actual project landing process, so the model needs to be monitored and continuously deployed.
This chapter combines the foundational concepts of Machine Learning with the functional expertise of modern software development and engineering to help you develop production-ready Machine Learning knowledge.
Productionization of a Machine Learning solution is not a one-time thing. It is always under improving one-time through the iterative process continuously.
“Machine learning is a highly iterative process: you may try many dozens of ideas before finding one that you’re satisfied with.” – Andrew Ng
The Machine Learning lifecycle, also known as MLOps(Machine Learning Operations), could be mapped and fit into the traditional software development process. A better understanding of Machine Learning will help you as you think about how to incorporate machine learning, including models, into your software development processes.
A Machine Learning lifecycle consists of such major phases, including:
problem framing,
data engineering,
model training & evaluation,
deployment,
maintenance.

Fig. 34.4 Machine Learning Lifecycle#
In the below sections, we will walk through the Machine Learning lifecycle components with a real-world example.
34.1. Problem framing#
To bring a Machine Learning solution to production successfully, the first step is to define a valuable business objective and translate the objective into a Machine Learning solvable problem.
COVID-19 Projections is an artificial intelligence solution to accurately forecast infections, deaths, and recovery timelines of the COVID-19/coronavirus pandemic in the US and globally. By the end of April 2020, it was cited by the Centers for Disease Control & Prevention (CDC) as one of the first models to “help inform public health decision-making”.
“I began estimating true infections in November 2020 because I couldn’t find any good models that were doing that in real-time during a critical moment in the pandemic (though there were 30+ models for forecasting deaths)… My goal when I started covid19-projections.com was to create the most accurate COVID-19 model.” – Youyang Gu, creator of covid19-projections.com
There have been three separate iterations of the covid19-projections.com model, which are Death Forecasts, Infections Estimates, and Vaccination Projections. We will use the Death Forecasting model as an example to explore how to frame a Machine Learning problem.
Let’s start with answering some Problem Framing related basic questions:
What are the inputs?
time-series table of death data with geography and demography information. For example to United Status, each row of the data needs to have a number of deaths \(x\) at date \(y\) in the region \(z\).
What are the outputs?
a number of deaths \(x'\) at a given future date \(y'\) in region \(z'\).
What are the metrics to measure the success of the project? Such as,
projection accuracy, precision, etc. - comparing with existing Machine Learning models and real-world data,
model inference speed - comparing with existing Machine Learning models,
etc.
What are the system architecture and required infrastructure?
a data pipeline to refresh the input data regularly,
a Machine Learning pipeline to regularly iterate the model by using the latest input data,
an event schedule module to manage the system communication and collaboration,
and a website to show the projected results and be accessible in real-time.
Any other questions? Such as,
is the data generally available and easy to access,
what are the existing solutions,
etc.
34.2. Data engineering#
34.2.1. Data ingestion#
COVID-19 Projections Death Forecasting model uses the daily death total provided by Johns Hopkins CSSE, which is considered by experts to be the “gold standard” reference data. It sometimes uses US testing data from the COVID Tracking Project in our research and graphs. Below is a piece of sample data from CSSE.
import pandas as pd

df = pd.read_csv('https://static-1300131294.cos.ap-shanghai.myqcloud.com/data/sample_time_series_covid19_deaths_US.csv')
df.head()
| UID | iso2 | iso3 | code3 | FIPS | Admin2 | Province_State | Country_Region | Lat | Long_ | ... | 6/17/22 | 6/18/22 | 6/19/22 | 6/20/22 | 6/21/22 | 6/22/22 | 6/23/22 | 6/24/22 | 6/25/22 | 6/26/22 | |
|---|---|---|---|---|---|---|---|---|---|---|---|---|---|---|---|---|---|---|---|---|---|
| 0 | 84001001 | US | USA | 840 | 1001.0 | Autauga | Alabama | US | 32.539527 | -86.644082 | ... | 217 | 217 | 217 | 217 | 217 | 217 | 217 | 217 | 217 | 217 |
| 1 | 84001003 | US | USA | 840 | 1003.0 | Baldwin | Alabama | US | 30.727750 | -87.722071 | ... | 683 | 683 | 683 | 683 | 683 | 683 | 683 | 683 | 683 | 683 |
| 2 | 84001005 | US | USA | 840 | 1005.0 | Barbour | Alabama | US | 31.868263 | -85.387129 | ... | 99 | 99 | 99 | 99 | 99 | 99 | 99 | 99 | 99 | 99 |
| 3 | 84001007 | US | USA | 840 | 1007.0 | Bibb | Alabama | US | 32.996421 | -87.125115 | ... | 105 | 105 | 105 | 105 | 105 | 105 | 105 | 105 | 105 | 105 |
| 4 | 84001009 | US | USA | 840 | 1009.0 | Blount | Alabama | US | 33.982109 | -86.567906 | ... | 245 | 245 | 245 | 245 | 245 | 245 | 245 | 245 | 245 | 245 |
5 rows × 899 columns
The above data is publicly available, and able to be automatically and easily sourced by a web crawler. There are also other ingestion approaches, including synthetic data simulation and manual collecting.
34.2.2. Data processing#
Typical data processing includes data cleaning, labeling, feature engineering, and augmentation.
For example, because the CSSE raw data may be noisy, a smoothing algorithm is first to smooth the data. For example, if a state reports 0 death on one day and 300 deaths the next day, the data is smoothed to show 150 deaths on each day. Sigmoid Function is used for this process as shown in below code snippet.
def inv_sigmoid(shift=0, a=1, b=1, c=0):
    """Returns a inverse sigmoid function based on the parameters."""
    return lambda x: b * np.exp(-(a*(x-shift))) / (1 + np.exp(-(a*(x-shift)))) + c

def get_transition_sigmoid(inflection_idx, inflection_rate, low_value, high_value,
        check_values=True):
    """Returns a sigmoid function based on the specified parameters.
    A sigmoid helps smooth the transition between low_value and high_value,
        with the midpoint being inflection_idx.
    inflection_rate is typically a value between 0-1, with 1 being a very steep
        transition. We typically use 0.2-0.5 in our projections.
    """
    if check_values:
        assert 0 < inflection_rate <= 1, inflection_rate
        assert 0 < low_value <= 10, low_value
        assert 0 <= high_value <= 10, high_value
    shift = inflection_idx
    a = inflection_rate
    b = low_value - high_value
    c = high_value
    return utils.inv_sigmoid(shift, a, b, c)
34.3. Model training & evaluation#
34.3.1. Model algorithm#
A Grid Search based approach is used as the model algorithm, which is similar to the traditional way of performing hyperparameter optimization. Grid Search builds a model on each parameter combination possible. It iterates through every different combination and stores a model for each of them.
The algorithm is built on top of an SEIR(susceptible-exposed-infectious-recovered) simulator. SEIR is a modified SIR epidemiology model which is applied to the mathematical modeling of infectious diseases.

Fig. 34.5 SEIR Model#
The simulator generates infection and death data according to the pre-defined static parameters. By comparing the simulated data with real-world data, it gets the simulator performance under a certain parameter setting.

Fig. 34.6 Death Forecasting Model Overview#
The training of the Death Forecasting model is basically a Grid Search process. It is found that the brute-force Grid Search method that iterates through the entire parameter space is the most effective in finding an optimal set of parameters. So if there are \(10\) values for one parameter and \(10\) values for another parameter. Then there are \(100\) different parameter combinations for those two parameters. For parameters not able to be estimated as lacking data, the values are considered all equally, resulting in a wider confidence interval.
Based on such a strategy, the Grid Search algorithm searches the optimized SEIR simulator parameters from thousands of different combinations. Then the simulator with the optimized parameters could be used to predict the future death data.
34.3.2. Model testing#
To evaluate the result, the trained Death Forecasting model has been compared with existing Machine Learning approaches, such as the popular model developed by the Institute for Health Metrics and Evaluation (IHME). The latter is commonly referred to by the White House and the media. The detailed result could be found on the covid19-projections website.
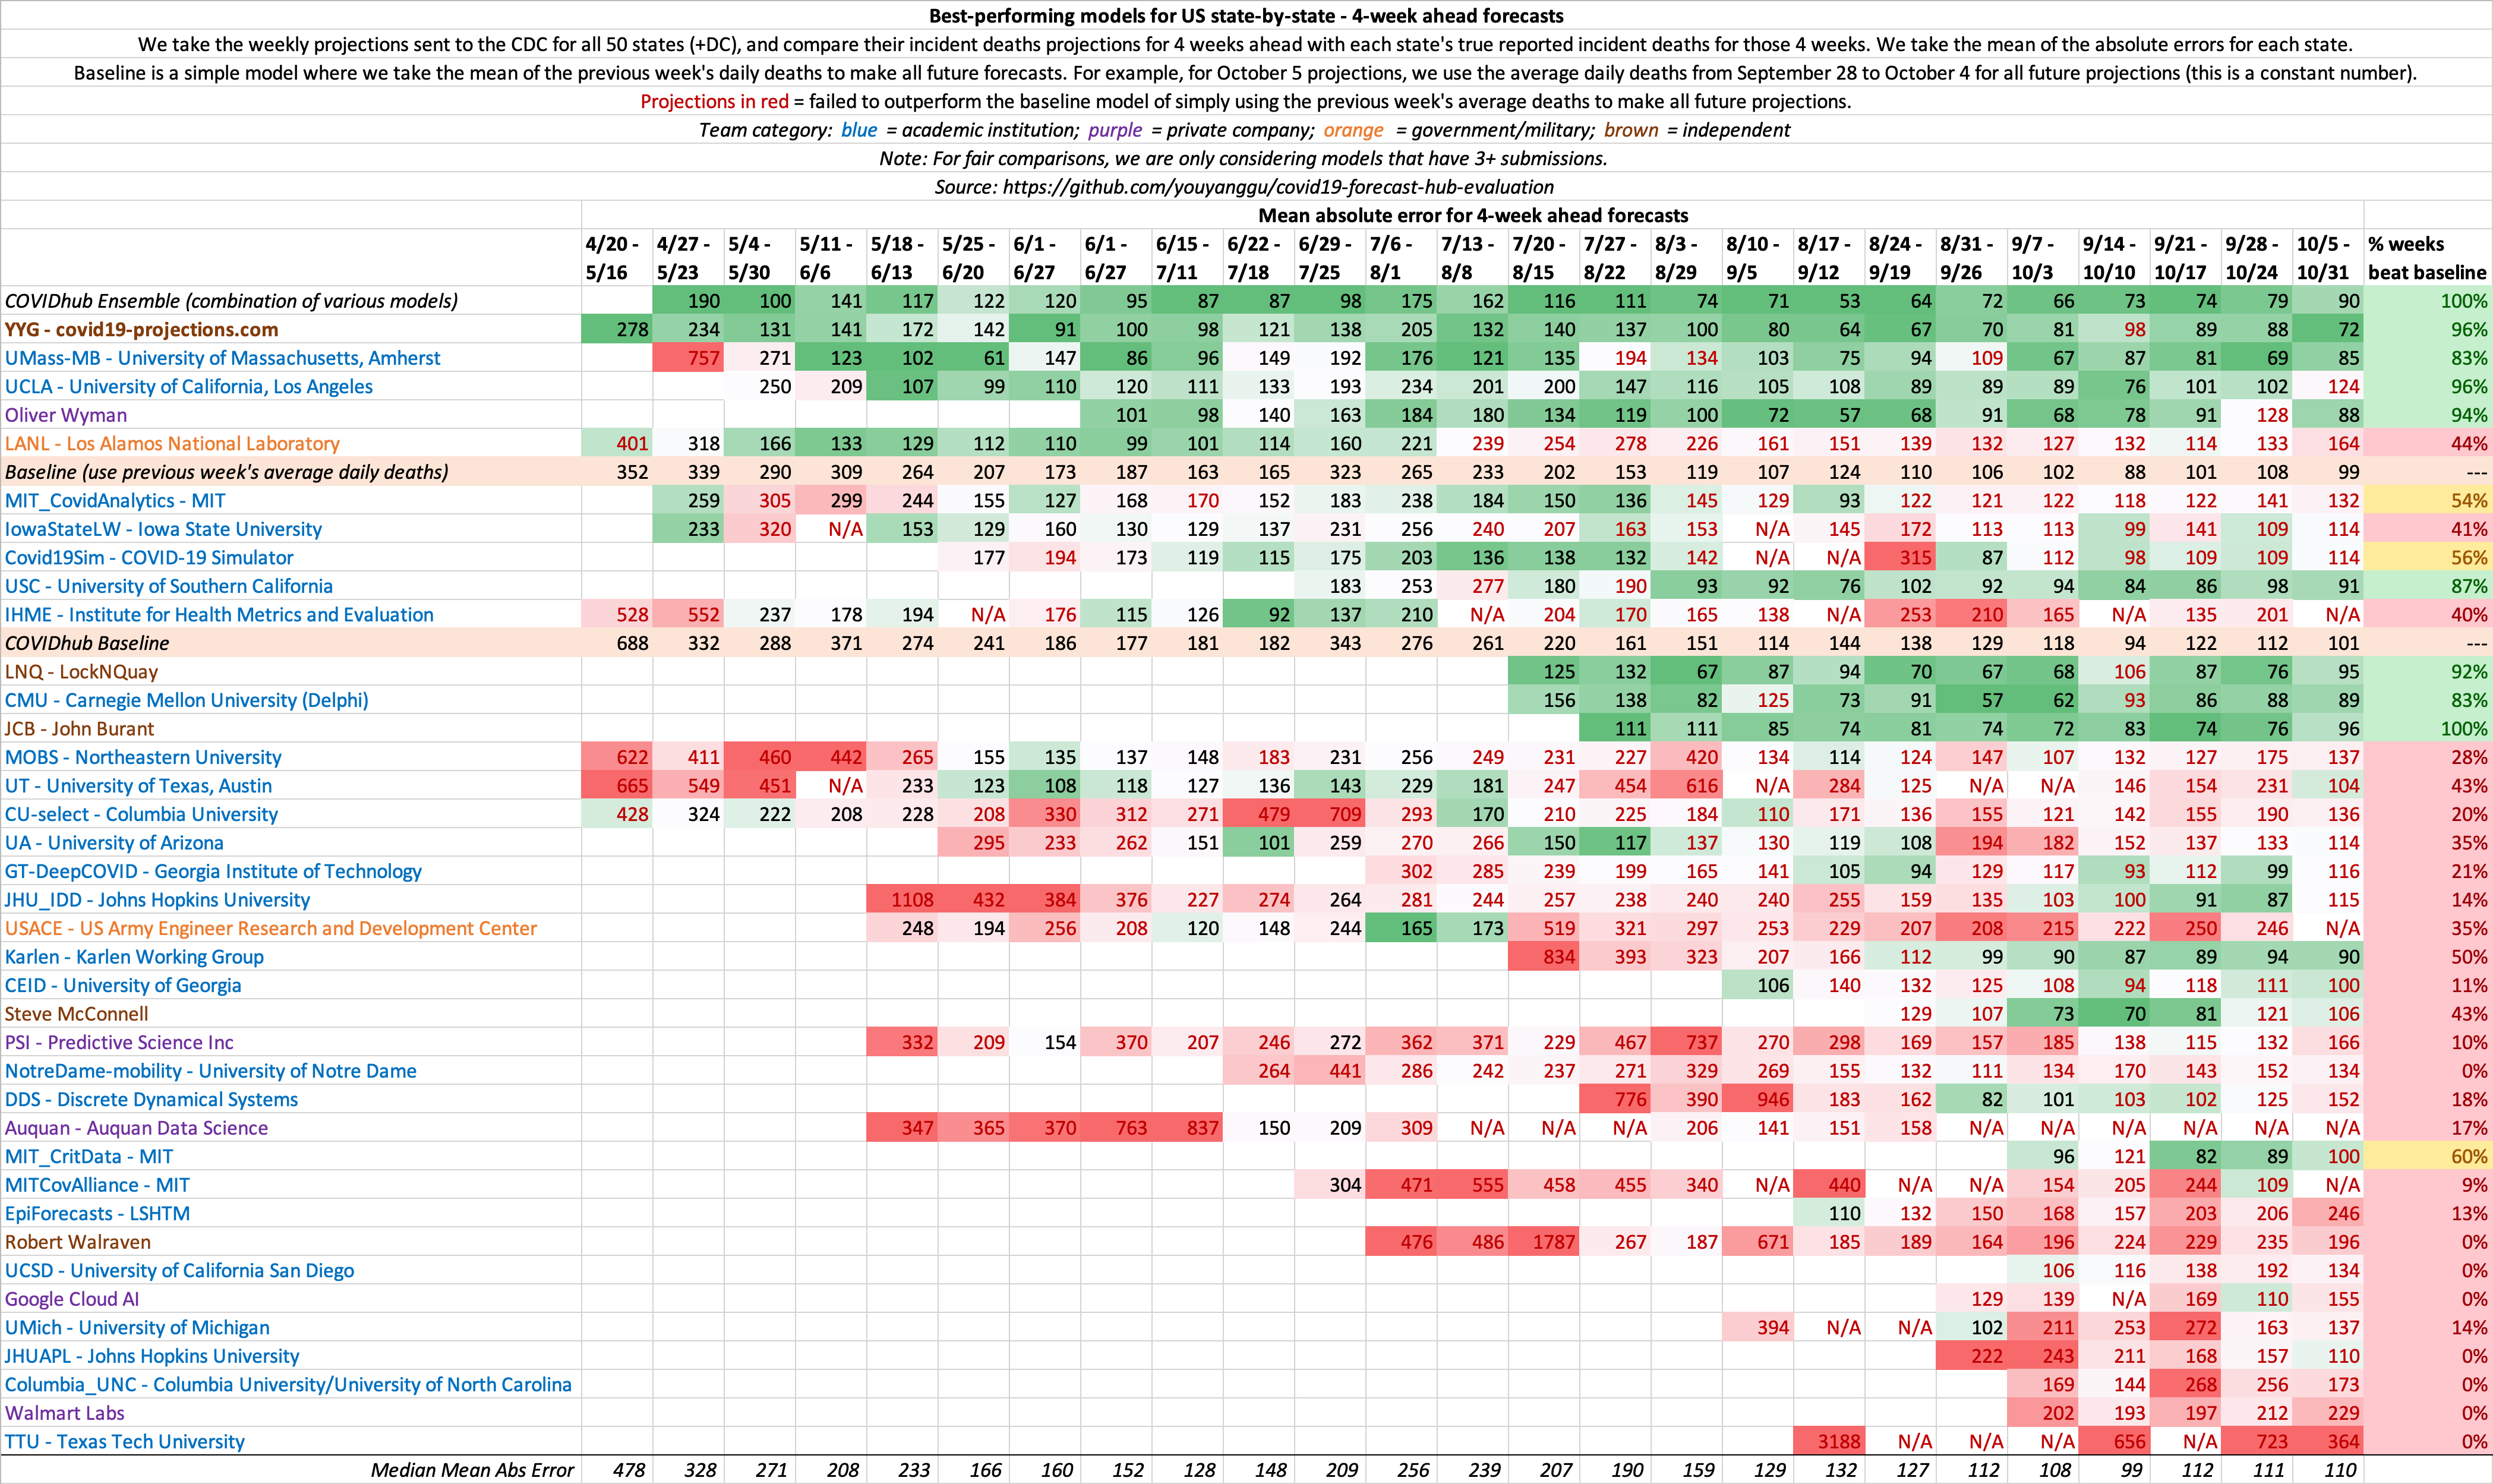
Fig. 34.7 Evaluation Between Different Machine Learning Model’s COVID-19 Death Projections#
The evaluation is more focused on accuracy. There are other Test-driven Machine Learning development methods, including unit testing, integration testing, etc.
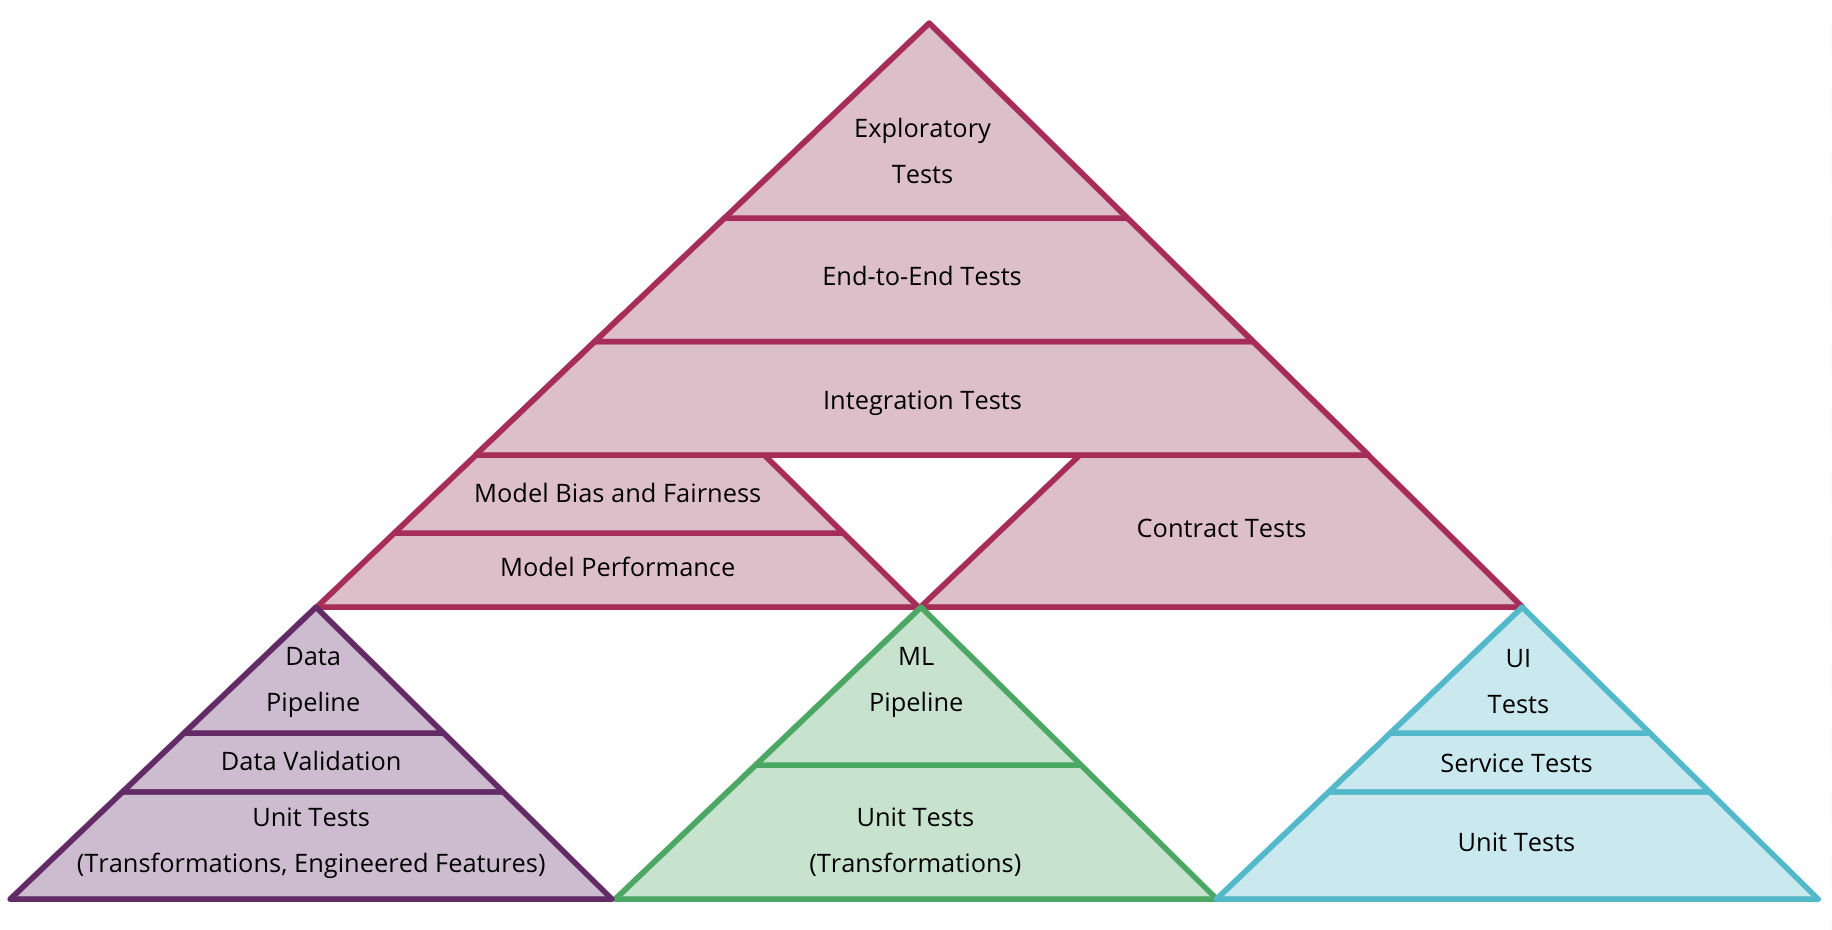
Fig. 34.8 The Machine Learning Test Pyramid from Martin Fowler#
34.4. Deployment#
The model training itself is handled manually. Every day, raw daily projections for all 50 US states and select international countries will be uploaded onto the COVID-19 Projections GitHub Pages. This will trigger the website building process, which is managed by Github Action and fully CI/CD.
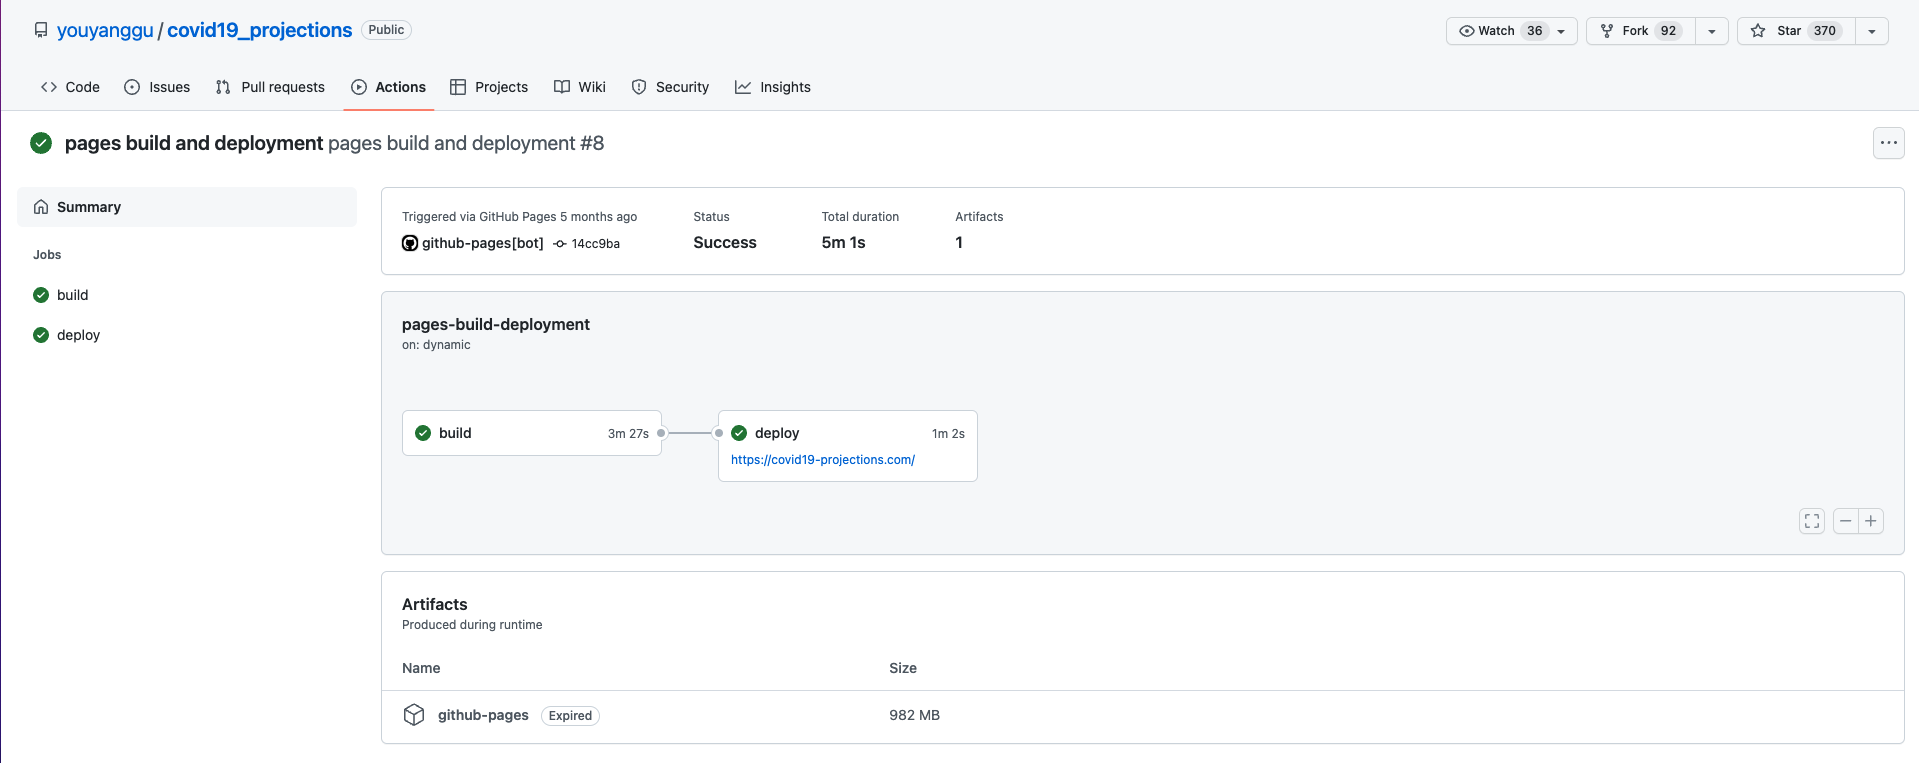
Fig. 34.9 COVID-19 Projection Github Action#
The Machine Learning model could be also deployed on an embedded device or as a service. You could refer to AWS Greengrass and AWS SageMaker to learn more.
34.5. Maintenance#
Model drift refers to the degradation of model performance due to changes in data and relationships between input and output variables. In order to deal with model drift, continuous model monitoring is the key.
The covid19-projection is a part-time project. During the author actively worked on it, the past performance is evaluated weekly. The historical performance along with other models are presented in the COVID-19 Forecast Hub, which is a website that maintains the authoritative, up-to-date record for forecasts of COVID-19 cases, deaths, and hospitalizations in the US. The latest forecasts from these models were sent to the CDC weekly and presented on the CDC COVID-19 Forecasting page. Also, the evaluation results were used to guide the model iteration for better consistency and accuracy.
34.6. Your turn! 🚀#
It is time to start your own Machine Learning project!
In this session/assignment, you should come up with a Machine Learning Project idea. Everyone should, in the next session, present their idea with:
Your presentation should be limited to around 3 minutes. After the pitch, projects receiving the most votes would “survive”. You will then form groups of 3-4 students, each group sharing one common project.
You will present your mid-batch work in this manner:
And at the end of the batch (demo day), you will present your work in this manner:
See also
Those links are for you to get some inspirations for a conceiving Machine Learning Project: